Multivariate Tensor-based Subcortical Morphometry System
Quick Start Guide
1.Introduction
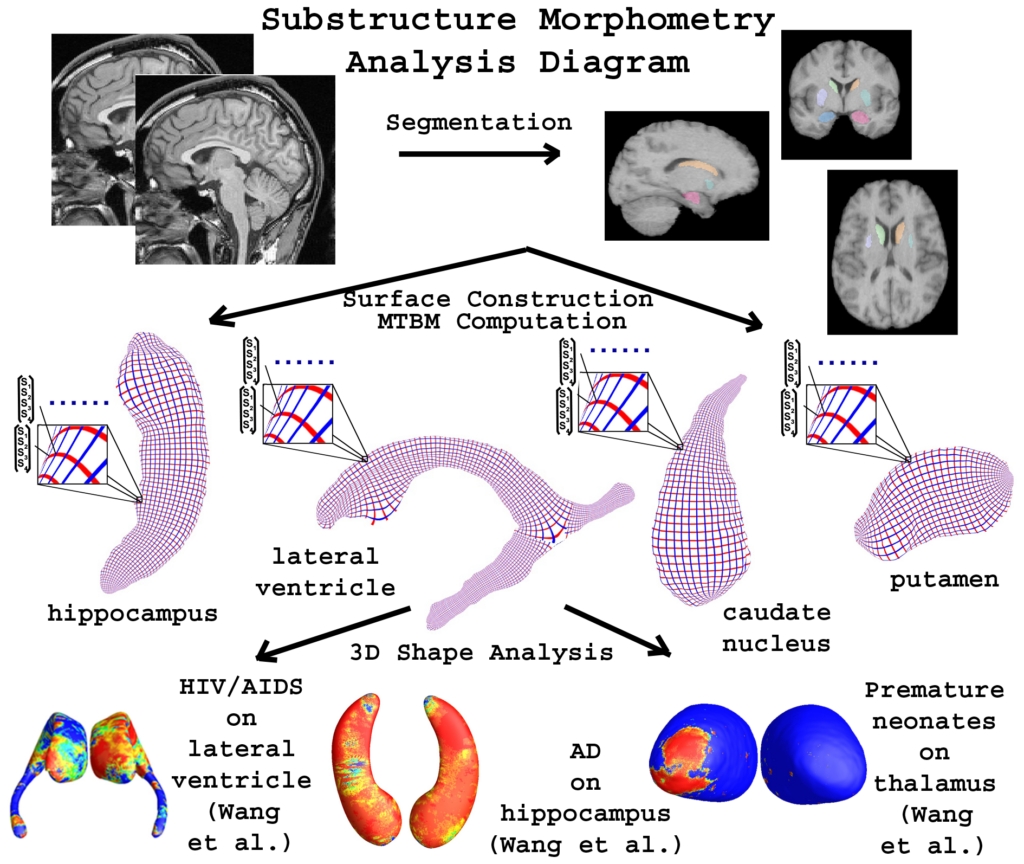
The Quick Start Guide to the Multivariate Tensor-based Subcortical Morphometry System (mTBM) covers the fundamental usages. For the more detailed description of the system features, please see the User Guide. The system can only be used under Linux Operating System.
2.Installation
2.1 Executable Code and Software
FSL toolbox
Executable Code and python scripts in folder mtbm
Example in folder example
2.2 Download
Linux FSL toolbox 5.0.9 installation. https://fsl.fmrib.ox.ac.uk/fsl/fslwiki
The MTBM system package can be download here.
2.3 Setup
Run the following command to your terminal to install essential library to your system.
sudo apt-get update && sudo apt-get upgrade
sudo apt-get install build-essential
sudo apt-get install gcc-multilib
Install the following package to your system. https://packages.ubuntu.com/trusty/libxp6
Extract the mTBM package in your local disk.
FSL shell setup. https://fsl.fmrib.ox.ac.uk/fsl/fslwiki/FslInstallation/ShellSetup
3.Run FSL toolbox
3.1 Introduction
The command can segment the hippocampus from the MRI image.
3.2 Command
>> run_first_all –s L_Hipp,R_Hipp –i <input image with its directory> -o <output name and its directory>
3.3 Input and Output
Input: MRI image (.img/.hdr)
Output: Hippocampus image segmented from input image
NOTE: The output-file name should be the same with the input-file name and put them in the same folder. The next program will copy the output files automatically.
You can get the detailed description about the command here. https://fsl.fmrib.ox.ac.uk/fsl/fslwiki/FIRST/UserGuide
4.Run mTBM package
4.1 Introduction
The software will generate a mesh for the input hippocampus image and calculate feature for each vertex in the mesh.
4.2 Usage
>> python /*directory to the file*/HP_mtbm.py <input image file with its directory> <output directory>
4.3 Input and Output
Input: original image (only input the name of original MRI with its extension and the software would get the other files generated by last step)
Output: mesh file with features for each point. The type is .m and you can view the file by using the Matlab file.
filename_Lhippo_60k_std_par_flowed_jfeat.m
filename_Rhippo_60k_std_par_flowed_jfeat.m
NOTE: DO NOT use relative directory for the input and output.
5.Statistical Group different
5.1 Introduction
The software applied Hotelling’s T test to evaluate the overall significance of experimental result and give a significance p-map with p-values.
5.2 Usage
TBM: python //HippoUCF/Rainier/UCFGroupDifference/callMDetGrpDiff.py MTBM: python //HippoUCF/Rainier/UCFGroupDifference/callMMTBMGrpDiff..py
MADMTBM: python /**/HippoUCF/Rainier/UCFGroupDifference/callMMADMTBMGrpDiff.py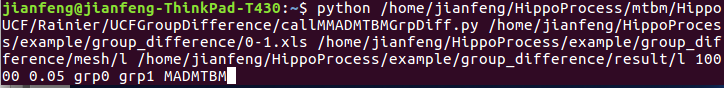
5.3 Input and Output
Input:
Excel file (.xls) which contains the file names of the mesh got from last step and their group label.

Input mesh fold directory
Output mesh folder directory
Repeat number (usually 10,000 or 15,000)
Statistical threshold (0.05)
The label of first group
The label of second group
String of experiment (TBM, MTBM, MADMTBM)
Output:
A file of p-map (outputname_mvgd_pmap.m)
A file with the significance (sigval_MAD.txt). The first line is the significance value if the FDR in the second line is zero. The second line is the significance value after using the theory of false discover rates (FDR).
Distribution functions of P values with y=x and y=20x.
NOTE:
REMEMBER to put the left-hippocampus files and right-hippocampus into different directories. You need to run the program for left hippocampus and right hippocampus separately.
In the excel file, you don’t need to write the full name of your file but just use the first several characters before symbol, ‘_’.